phc: module of astronomical functions
PyHdust phc module: physical constants and general use functions
Includes functions for: - Geometrical functions in deg - Data manipulation (average, bin, fitting) - Manipulation of 3D coordinates - Convolution functions - Manipulation of strings and lists - Manipulation of angular coordinates and dates - Files or directories manipulation - Plotting - Physical functions - List of constants - Python-version issues
- license:
GNU GPL v3.0 https://github.com/danmoser/pyhdust/blob/master/LICENSE
- pyhdust.phc.BBlbd(T, lbd=None)[source]
Black body radiation as function of lambda. CGS units (erg s-1 sr−1 cm−3).
INPUT: lambda vector in cm. If None, lbd = _np.arange(1000, 10000, 100) * 1e-8 #Angs -> cm
- class pyhdust.phc.Constant(cgs, SI, unitscgs='', info='No available description')[source]
Class for a physical/astronomical constant
- pyhdust.phc.add_subplot_axes(ax, rect, axisbg='w')[source]
Generate a subplot in the current axis. Warning: the labels with be proportionally smaller.
Originally in http://stackoverflow.com/questions/17458580/
- Example:
fig = plt.figure() ax = fig.add_subplot(111)] rect = [0.2,0.2,0.7,0.7] ax1 = add_subplot_axes(ax,rect)
- Alternative solution:
# Here the labels have the same size from mpl_toolkits.axes_grid.inset_locator import inset_axes inset_axes = inset_axes(parent_axes,
width=”30%”, # width = 30% of parent_bbox height=1., # height : 1 inch loc=3)
# “bbox_to_anchor” gives VERY strange results…
- pyhdust.phc.baricent_map(x, y, z, res=100, fullrange=False, xfact=1.0, yfact=1.0)[source]
_fact = apply an factor in the input values in the interpolation
- pyhdust.phc.bin_ndarray(ndarray, new_shape, operation='avg')[source]
- Bins an ndarray in all axes based on the target shape, by summing or
averaging.
Number of output dimensions must match number of input dimensions.
Example
>>> m = _np.arange(0,100,1).reshape((10,10))
>>> n = bin_ndarray(m, new_shape=(5,5), operation='sum')
>>> print(n)
[[ 22  30  38  46  54]
 [102 110 118 126 134]
 [182 190 198 206 214]
 [262 270 278 286 294]
 [342 350 358 366 374]]
- pyhdust.phc.bindata(x, y, yerr=None, nbins=20, xlim=None, interp=False, perc=0, weightx=True)[source]
Return the weighted binned data. It is assumed no errors for x values.
interp linearly interpolates NaN values in y (no changes on x and yerr arrays).
if
perc > 0, then it returns the percentile value of the interval. In this case, the output xvals will be the ones from the closest y value within a given bin corresponding to that percentile.weightx only works if perc=0. True returns the simply averaged x value of a given bin interval (it is not based on y or yerr values); False returns the regularly spaced x bin values.
INPUT: x, y, yerr - arrays with the same shape (they don’t need to be sorted); nbins=int, xlim=[xmin, xmax].
OUTPUT: xvals, yvals, new_yerr [if yerr!=None]; (arrays)
- pyhdust.phc.cart2sph(x, y, z=None)[source]
Cartesian to spherical coordinates. Output in rad. Warning: \(z=0\rightarrow \theta=\pi\).
TODO: check is len(x)==len(y)
INPUT: arrays of same length
OUTPUT: arrays
- pyhdust.phc.cart_rot(x, y, z, ang_xy=0.0, ang_yz=0.0, ang_zx=0.0)[source]
Apply rotation in Cartesian coordinates.
INPUT: 3 arrays of same length, 3 angles (float, in radians).
OUTPUT: arrays
- pyhdust.phc.change_dimension(x, nred=-1, fixedlim=False)[source]
Reduce the dimension of an equally spaced vector.
nred: reduces the vector x size if nred < 0 and increases it otherwise.
fixedlim keeps the x limits values. Others
- pyhdust.phc.chi2calc(mod, obs, sig_obs=None, npar=1, fast=False)[source]
Calculate the chi2.
If fast=False, the function skips a NaN test in the arrays.
- pyhdust.phc.civil_ticks(ax, civcfg=[1, 'm'], civdt=None, tklab=True, label='%y %b %d', **kwargs)[source]
Add the civil ticks in the axis.
- Parameters:
civcfg – forces a given timestep between the ticks [n, interval].
Interval can be day (d), month (m) or year (y). :param civdt: sets the initial tick date. Format: [Y, M, D] :param tklab: if False, the civil date labels are not written. :param label: define the label for the
date.strftimeto be displayed in the tick labels.- EXAMPLE:
fig, ax = plt.subplots() ax.plot(x, y) ax = phc.civil_ticks(ax)
- pyhdust.phc.closest_idx(arr, mtx)[source]
Return the closest index of mtx corresponding to the values of arr.
- pyhdust.phc.convnorm(x, arr, pattern)[source]
Do the convolution of arr with pattern. Vector x is required for normalization. Its length must be odd!
INPUT: units space (x, array), original array (arr), pattern (array)
OUTPUT: array
- pyhdust.phc.csvread(fname, delimiter=',')[source]
Read a CSV file and return it as a list (table). It handles entries with quotation marks as a single column.
- pyhdust.phc.cycles(i=0, ctype='cor')[source]
Cycle between values of the phc.colors, phc.line_styles and phc.filled_markers lists.
INPUT: valid ctypes are: [‘cor’,’ls’,’mk’]
OUTPUT: the corresponding value of the list.
- pyhdust.phc.dtflag(ms=False)[source]
It returns the current “datetime” flag, i.e., a string of the current date and time formated as yyyymmdd-hhMM.
- pyhdust.phc.enable_minorticks(ax, auto=None, axis='x')[source]
Enable minor ticks
- Parameters:
auto – argument to AutoMinorLocator, to specify a fixed number of
minor intervals per major interval. :param axis: [‘x’, ‘y’, ‘both’]
- pyhdust.phc.expand_list(xlist, logspaced=False)[source]
Expand
xlistcentered values to interval limits.logspaced assumed to be in base 10.
OUTPUT: array[len(xlist)+1]
- pyhdust.phc.fBBcor(T)[source]
Correction as appendix B Vieira+2015. Stellar atmospheric models systematically have a LOWER flux than a BB of a given Teff temperature in IR (at least for Early-type stars).
fBBcor(T)*BBlbd(Teff) == Kurucz(Teff)
INPUT: Teff (Kurucz). log g = 4.0
OUTPUT: fBBcor(T) < 1.0
- pyhdust.phc.fill_points(in_arr, dx, n=1)[source]
Return a list of points to be filled in an array.
- If the distance of two sucessive points is bigger than
dx, thenn new points will be generated.
- Parameters:
in_arr – Input array.
- If the distance of two sucessive points is bigger than
- pyhdust.phc.find_nearND(matrix, array, idx=False, bigger=None, outlen=1)[source]
Find nearest array values in a MATRIX.
INPUT: array, value
OUTPUT: closest value (array dtype)
- pyhdust.phc.find_nearest(array, value, bigger=None, idx=False)[source]
Find nearest VALUE in the array and return it.
INPUT: array, value
OUTPUT: closest value (array dtype)
- pyhdust.phc.find_neighbours(par, par_grid, ranges, silent=True)[source]
Finds neighbours’ positions of par in par_grid.
Usage: keep, out, inside_ranges, par_new, par_grid_new = find_neighbours(par, par_grid, ranges, silent=True)
where redundant columns in ‘new’ values are excluded, but length is preserved (i.e., par_grid[keep] in griddata call).
- pyhdust.phc.flatten(list_, outlist=None)[source]
Return a flatten list.
If
outlistis provided, the output is extended to it.
- pyhdust.phc.fltTxtOccur(s, lines, n=1, seq=1, after=True, asstr=False)[source]
Return the seq-th float of the line after the n-th occurrence of s in the array lines.
INPUT: s=string, lines=array of strings, n/seq=int (starting at 1)
OUTPUT: float
- pyhdust.phc.fracday2hms(frac)[source]
Enter fraction of a day (e.g., MJD) and return integers of hour, min, sec.
INPUT: float
OUTPUT: hour, min, sec (int, int, int)
- pyhdust.phc.gbf(T, lbd)[source]
Gaunt factors from Vieira+2015.
INPUT: T (K) and lbd (:math:`mu`m, array)
log(T /K) G0 G1 G2 B0 B1 B2
- pyhdust.phc.gentkdates(mjd0, mjd1, fact, step, dtstart=None)[source]
Generates round dates between
mjd0andmjd1in a given step. Validstepsare:‘d/D/dd/DD’ for days; ‘w/W/ww/WW’ for weeks; ‘m/M/mm/MM’ for months; ‘y/Y/yy/YY/yyyy/YYYY’ for years.
dtstart (optional) is expected to be in _datetime._datetime.date() format [i.e., datetime.date(yyyy, m, d)].
factmust be an integer.INPUT: float, float, float, int, step (see above), dtstart (see above)
OUTPUT: list of _datetime.date
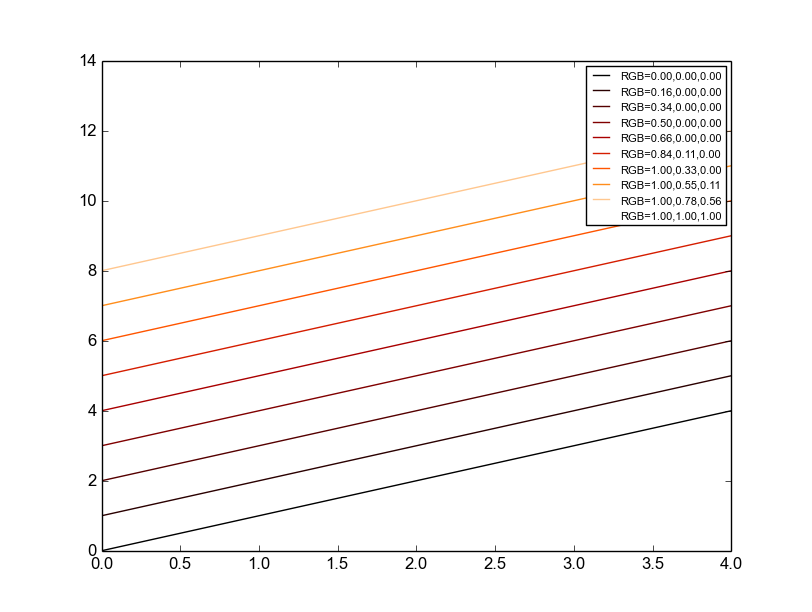
- pyhdust.phc.gradColor(val, cmapn='jet', vmin=None, vmax=None, log=False)[source]
Return the corresponding value(s) color of a given colormap.
Good options, specially for lines, are ‘jet’, ‘gnuplot’, ‘brg’, ‘cool’ and ‘gist_heat’ (attention! Here vmax is white!).
cor = phc.gradColor(arange(10), cmapn='gist_heat')
for i in range(0,10):
    cor = phc.gradColor(arange(10), cmapn='gist_heat')[i]
    print cor
    plt.plot(arange(5)+i, color=cor, label='GB='+('{0:4.2f},'*3).
        format(*cor)[:-1])

plt.legend(fontsize=8)
- pyhdust.phc.greg2MJD(yr, mon, day, fracday)[source]
It returns the MJD of a given YYYY,MM,DD (integers) and fraction of the day (float) as a float.
- pyhdust.phc.hms2fracday(hms)[source]
Enter hour:min:sec (string) and return fraction of a day (float)
- pyhdust.phc.interLinND(X, X0, X1, Fx, disablelog=False)[source]
N-dimensional linear interpolation in LOG space!!
Pay attention: Fx must always be > 0. If not, put disablelog=True.
Other important thing: Fx must be regularly spaced (i.e., [Fx0y0, Fx0y1, Fx1y0, Fx1y1] if X0=[x0,y0] and X1=[x1,y1]).
If it is not the case, see interBar?D function.
INPUT:X = position in with the interpolation is desired;X0 = minimal values of the interval;X1 = vmaximum values of the inveralFx = function values along the interval, ORDERED BY DIMENSTION.Example: Fx = [F00, F01, F10, F11]OUTPUT: interpolated value (float)
- pyhdust.phc.is_inside_ranges(par, ranges)[source]
Checks if par is inside ranges, returns boolean value.
Usage: inside_ranges = is_inside_ranges(par, ranges)
- pyhdust.phc.isnumber(val, contains=False)[source]
Return [True|False] if a string can be converted to a number (int, float or scientific notation).
contains: check if the string CONTAINS a valid number.
- pyhdust.phc.keys_values(keys, text, delimiter='_')[source]
Return the values in a string coded as KeyValueDelimiter. The keys do not need to be in order in the text.
Important! The text can not start with a keyword (if it is the case, add a delimiter first) and it must have a delimiter after the last key.
TODO: Relax the important message considering starting with the first key and a sign as last delimiter.
Example:
keys = ['M', 'ob', 'H', 'Z', 'b']
text = 'Be_M04.20_ob1.30_H0.30_Z0.014_bE_Ell.txt'

print( phc.keys_values(keys, text) )
- pyhdust.phc.lawkep(M=None, m=None, P=None, a=None)[source]
Kepler law calc. Kepp None on what you what to calc.
Units are in Solar System one, what is, masses in Msun and P in years.
a is the distance between the two bodies, measured in AU.
One can also use the Centre-of-Mass equation a1*M1 = a2*M2 to relate the two masses.
- pyhdust.phc.log_norm(x, vmax=1.0, vmin=0.01, autoscale=True, clip=True)[source]
Renormalize
x(value or vector) making a correspondance of [0-1] to [vmin, vmax] in log scale.If
autoscaleand x is a vector,vmaxandvminare automatically set (xmust have at least a positive value).clipforce the range to be between 0 and 1.
- pyhdust.phc.mag_plot(ax, ylabel='mag$_V$', civcfg=[1, 'y'], civdt=[1996, 1, 1], civlabel='%Y')[source]
TODO
- pyhdust.phc.n_air(lbd=0.55, T=300.15, P=1013.25, wp=6.113)[source]
Air refraction index.
- Parameters:
lbd – wavelength in microms
T – temperature in K
P – atmospheric pressure in mbar
wp – water vapor pressure in mbar
For all practical purposes, the refractive index is affected only by air temperature.
- pyhdust.phc.nan_helper(y)[source]
Helper to handle indices and logical indices of NaNs.
- Input:
y, 1d numpy array with possible NaNs
- Output:
nans, logical indices of NaNs
index, a function, with signature indices= index(logical_indices), to convert logical indices of NaNs to ‘equivalent’ indices
Example
>>> # linear interpolation of NaNs
>>> nans, x = nan_helper(y)
>>> # x is a lambda "sequence" function to interpolation purposes
>>> y[nans]= _np.interp(x(nans), x(~nans), y[~nans])
- pyhdust.phc.normGScale(val, vmin=None, vmax=None, log=False)[source]
Return the normalized values of a given array to 0 and 255 (gray scale).
If log then the normalization is done in this scale.
If min and max are not set, it is assumed that the values are from the list.
>>> phc.normGScale(np.linspace(0,10,10), 0, 10)
array([  0,  28,  57,  85, 113, 142, 170, 198, 227, 255])
>>> phc.normGScale(np.linspace(0,10,10))
array([  0,  28,  57,  85, 113, 142, 170, 198, 227, 255])
>>> phc.normGScale(np.linspace(0,10,10), 0, 10, log=True)
array([  0,   0,  80, 128, 161, 187, 208, 226, 241, 255])
>>> phc.normGScale(np.logspace(0,1,10), 0, 10, log=True)
array([  0,  28,  57,  85, 113, 142, 170, 198, 227, 255])
>>> phc.normGScale(np.logspace(0,1,10), 0, 10)
array([ 26,  33,  43,  55,  71,  92, 118, 153, 197, 255])
>>> phc.normGScale(np.logspace(0,1,10))
array([  0,   8,  19,  33,  51,  73, 103, 142, 191, 255])
- pyhdust.phc.normbox(hwidth, x=None, xc=0.0)[source]
Normalized Box function.
INPUT: half-width (number), x (array), xc (float)
OUTPUT: yvals (array)
- pyhdust.phc.normgauss(sig, x=None, xc=0.0)[source]
Normalized Gaussian function.
INPUT: sigma value (float), x (array), xc (float)
OUTPUT: yvals (array)
- pyhdust.phc.optim(p0, x, y, yerr, func, errfunc=None)[source]
Do scipy.optimize.leastsq minimization. Default error function is the chi2 function.
- Requirements:
func(p, x) is a previously user defined function.
len(x)=len(y)=len(yerr)
- Output:
best parameters (p), chi2_red value
- pyhdust.phc.optim2(p0, x, y, yerr, func)[source]
Do scipy.optimize.curve_fit minimization. It returns errors to the parameters fitting!!!
- Requirements:
func(p, x) is a previously user defined function.
len(x)=len(y)=len(yerr)
- Output:
best params (p), params errors (perr), chi2_red value
- pyhdust.phc.outfld(fold='hdt')[source]
Check and create (if necessary) an (sub)folder - generally used for output.
INPUT: *fold=string
OUTPUT: *system [folder creation]
- pyhdust.phc.output_rename(fullpath, prefix)[source]
Replace FILENAME prefix to the one set here.
The routine is based on the ‘_’ character.
Example: folder/SED_mod1a.sed2 > folder/bin_mod1a.sed2
- pyhdust.phc.range_centered(xi, xf, n)[source]
To get the edges of the range, just do
np.linspace(xi, xf, n+1).
- pyhdust.phc.readfixwd(fname, wlims, chklims=True)[source]
chklims: read line from beginning until the end
- pyhdust.phc.readpck(n, tp, ixdr, f)[source]
Read XDR
n: length
tp: type (‘i’, ‘l’, ‘f’, ‘d’)
ixdr: counter
f: file-object
- Returns:
ixdr (counter), _np.array
- pyhdust.phc.readrange(file, i0, ie)[source]
Read a specific range of lines of a file with minimal memory use.
Note that i == n-1 for the n-th line.
INPUT: string, int, int
OUTPUT: list of strings
- pyhdust.phc.recsearch(root='./', fstr=[''], allfstr=True, fullpath=False)[source]
Do a recursive search in root looking for files containg fstr.
fstr must be a list!
If allfstr is True, all itens in fstr must be in the path+file names structure. If False, any of the itens must be.
INPUT: root (string), fstr (list of strings)
OUTPUT: list of strings
- pyhdust.phc.renlist(root, newr)[source]
The routine changes each A_STR_B to A_NEW_B inside the running folder.
- pyhdust.phc.renormvals(xlist, xlims, ylims)[source]
Renormalize
xlistaccording to_limsvalues.len(xlims)=len(ylims)=2
- pyhdust.phc.repl_fline_val(f, iline, oldval, newval)[source]
Replace oldval by newval in f[iline]
return f replaced.
- pyhdust.phc.reshapeltx(ltxtb, ncols=2, latexfmt=True)[source]
Reshape a latex table.
- Parameters:
ltxtb (string, or list of strings) – latex table (only contents)
- Return type:
string, or _np.array (str)
- Returns:
latex formatted table, or matrix
- pyhdust.phc.rmext(name)[source]
Remove the extension of a filename. Criteria: last . sets the extension.
INPUT: filename (string)
OUTPUT: filename without extension (string)
- pyhdust.phc.savefig(fig, figname=None, fmt=['png'], keeppt=False, dpi=150, transp=True)[source]
Standard way of saving a figure in PyHdust.
- pyhdust.phc.splitequal(n, N)[source]
Split N in approx. n igual parts
N must be integer.
Suggestion: phc.splitequal(N/8., N) split N into sequences of approx. 8 itens.
- pyhdust.phc.splitfilelines(n, file)[source]
Break the file into n files. It also erases the expression “qsub “.
OUTPUT: file_##.txt
- pyhdust.phc.str2float(val)[source]
Returns a float converted from the string
val.If more than one float is identified, it returns
None
- pyhdust.phc.strrep(seq, n, newseq)[source]
Insert newseq at position n of the string seq.
seq[n] = seq[:n]+newseq+seq[n+1:]
Note: the string at the position n is replaced!!!
OUTPUT: string
- pyhdust.phc.trimpathname(file)[source]
Trim the full path string to return path and filename.
INPUT: full file path
OUTPUT: folder path, filename (strings)
- pyhdust.phc.wg_avg_and_std(values, sigma)[source]
Return the weighted average and standard deviation.
- This IS NOT the problem of Wikipedia > Weighted_arithmetic_mean +
Weighted_sample_variance!
average = _np.average(values, weights=weights) # Fast and numerically precise: variance = _np.average((values-average)**2, weights=weights) return (average, _np.sqrt(variance))
INPUT: values, sigma – arrays with the same shape.
OUTPUT: average, avg_sig (float, float)
- pyhdust.phc.wg_avg_t(t, y, yerr=None)[source]
average weighted on
twith optionalyerrarray.Intended for binning use. To recover the weighted value of
t, use wg_avg_and_std.Warning: If there is two (or more)
ypoints for the same value oft, all these points will be ignored.INPUT:
t,y– arrays with the same shape.OUTPUT: average