spectools: module of spectroscopic tools
PyHdust spectools module: spectroscopy tools
Algumas definicoes: para todas as rotinas funcionarem, todos os espectros devem estar agrupados num mesmo caminho (path), em estrutura de noite/estrelas/espec.
Currently the functions only read *.cal.fits files. The .cal suffix means
a header with the following keywords:
‘MJD-OBS’ or ‘MJD’ or ‘JD’ or ‘DATE-OBS’
‘CRVAL1’ + ‘CDELT1’
A useful tool for normalizing spectra with Python (not used/imported here): https://python4esac.github.io/plotting/specnorm.html
- license:
GNU GPL v3.0 https://github.com/danmoser/pyhdust/blob/master/LICENSE
- pyhdust.spectools.DCcalc(vels, flux, vmax=None, vc=0.0, ssize=0.05)[source]
Calculo, na presenca de emissao, da profundidade do reverso central.
Se fluxo máximo < 1.01*contínuo, retorna
TODO: gauss fit
Return flux at vmax (maximum considered velocity), and flux at v0. Depth of the central reversal is flux[ivmax] - flux[ivc].
- pyhdust.spectools.ECcalc(vels, flux, ssize=0.05, gaussfit=False, doublegf=True)[source]
Supoe que o fluxo jah estah normalizado, e vetores ordenados.
If gaussfit=False, the single maximum value is taken.
If gaussfit=True, then a single (doublegf=False) or a double (doublegf=True) Gaussian fit is performed over the line profile to determine its maximum.
Calcula o topo da emissao da linha, e retorna em que velocidade ela ocorre.
- pyhdust.spectools.EWcalc(vels, flux, vw=1000)[source]
Supoe que o fluxo jah estah normalizado, e vetores ordenados.
Devolve o valor EW.
- pyhdust.spectools.FWHM(vels, flux, halfmax, vmax=350.0, flxincr=0.01)[source]
Calc. FWHM (Full-Width at Half Maximum) based on the value of the Half Maximum
TODO: Gaussfit
- pyhdust.spectools.PScalc(vels, flux, vc=0.0, ssize=0.05, gaussfit=False)[source]
Calcula peak_separation
doublegaussfit = True, do it before and after zero velocity. False, use maximum (default).
- class pyhdust.spectools.Spec(wl=None, flux=None, lbc=None, hwidth=1000.0, EW=nan, EC=nan, VR=nan, peaksep=nan, depthcent=nan, F0=nan, dateobs='', MJD=0.0, datereduc='', file='', gaussfit=False)[source]
Definicao de classe espectro para conter toda a informacao util para plots e analises.
EW in km/s
Para configurar uma ou mais linhas:
>>> spdtb = Spec()
>>> spdtb.lbc == 0
>>> #significa que vetor wl eh vetor velocidades, e nao comprimento de
>>> # onda.
>>> spdtb.lbc = 6564.
>>> spdtb2 = Spec()
>>> spdtb2.lbc = 4863.
Como usar (hard way):
>>> spdtb = Spec()
>>> #read spec `flux` and `wl` for a given `lbc`
>>> (spdtb.EW, spdtb.EC, spdtb.VR, spdtb.peaksep, spdtb.depthcent,\
>>> spdtb.F0) = analline(wl, flux, lbc)
>>> spdtb.MJD = 1
>>> spdtb.file = file
And then:
>>> #to record it to the database:
>>> spdtb.addspec()
Para carregar uma tabela anterior, faca:
>>> spdtb = Spec()
>>> #(...) read new specs and then join with previous ones
>>> spdtb.data = _np.vstack((spdtb.data, _np.loadtxt('hdt/datafile.txt')))
>>> spdtb.metadata = _np.vstack(( spdtb.metadata, \
>>> _np.loadtxt('hdt/metafile.txt') ))
>>> spdtb.updatecount() #to update the counter
Ou simplesmente (nome de arquivos default):
>>> spdtb.loaddata()
- loaddata(datafile='/datafile.txt', metafile='/metafile.txt')[source]
Function to load a previous table Usage:
>>> spdtb = Spec()
>>> spdtb.loaddata()
- pyhdust.spectools.VREWcalc(vels, flux, vw=1000)[source]
Supoe que o fluxo jah estah normalizado, e vetores ordenad_os.
Calcula o ew para os dois lados (azul/vermelho) da linha, ajustando a velocidade de repouso (TBD).
- pyhdust.spectools.VRcalc(vels, flux, vw=1000, gaussfit=False, ssize=0.05)[source]
Calcula o PICO para os dois lados (azul/vermelho) da linha, ajustando a velocidade de repouso (TBD).
- pyhdust.spectools.absLineCalc(vels, flux, vw=1000, ssize=0.05)[source]
Calculate the line flux (input velocity vector). The flux is NON-normalized.
ssizeparameter controns the size of flux that will be evaluated at the extreme of the input flux array to determine the continuum level.vels = (wv - lbc) / lbc * phc.c.cgs * 1e-5 # km/sOutput in the same flux units times \(\Delta v\) (both flux and v input units).
- pyhdust.spectools.absLineCalcWave(wv, flux, lbc, vw=1000, ssize=0.05, gauss=False, allout=False, spcas=None)[source]
Calculate the line flux (input velocity vector). The flux is NON-normalized.
ssizeparameter controns the size of flux that will be evaluated at the extreme of the input flux array to determine the continuum level.vels = (wv - lbc) / lbc * phc.c.cgs * 1e-5 # km/sOutput in the same flux units times \(\Delta v\) (both flux and v input units).
- pyhdust.spectools.absLineDeb(wv, flux, lb0, lb1, vw=1000, ssize=0.05, a0=None, sig0=None, allout=False)[source]
Return the area of a fitting Gaussian with debblending.
- pyhdust.spectools.air2vac(wl)[source]
The IAU standard for conversion from air to vacuum wavelengths is given in Morton (1991, ApJS, 77, 119). For vacuum wavelengths (VAC) in Angstroms, convert to air wavelength (AIR) via: AIR = VAC / (1.0 + 2.735182E-4 + 131.4182 / VAC^2 + 2.76249E8 / VAC^4 )
Fitting the inverse curve: VAC = AIR / (1.0 - 2.73443407E-4 - 1.31275255E2 / AIR^2 - 2.75708212E8 / AIR^4 )
- pyhdust.spectools.analline(lbd, flux, lbdc, hwidth=1000, verb=True, gaussfit=False, doublegf=True)[source]
Return the analysis of a line.
Both lbd and flux need to be ordered (a normalization IS FORCED). lbd,lbdc must have the same unit, and width in km/s is required. The line will be cutted so that the total DeltaLambda will be 2*width
if lbdc <= 0, lbd array is assumed to be a velocity array (in km/s)!
EXAMPLE: Using sed2data. lbc = 0.6565 (halpha), obs = 1 (width==1000)analline(lbd=sed2data[obs,:,2], flux=sed2data[obs,:,3], lbc=lbc)The EW is the equivalent width in km/s, EC is the Emission over Continuum ratio, VR ratio, peaksep in km/s, FWHM is the Full-Width at Half Maximum (emission as maximum) F0 is the depth of rest wavelength normalized to the continuum
OUTPUT: EW, EC, VR, peaksep, FWHM, F0
- pyhdust.spectools.automatic_BeSS(RA, DEC, size='0.2', date_lower='1000-01-01', date_upper='3000-01-01', band_lower='6.4e-7', band_upper='6.7e-7')[source]
This is a script for downloading BeSS spectra, directly from the database website, using VO Table and pandas dataframes
- Parameters:
RA (str) – Right ascension [° J200] as string
DEC (str) – Declination [° J2000] as string
size (str) – Radius of the cone search in degree as string
date_lower (str) – Initial date in format yyyy-mm-dd as string
date_upper (str) – Final date in format yyyy-mm-dd as string
lower (band) – Initial wavelength [meters] in scientific notation as string
band_upper (str) – Final wavelength [meters] in scientific notation as string
- Return type:
None, the routine downloads file in the script directory.
Example
#Halpha for 25 Cyg from 2019-10-01 to 2020-03-27 >>> RA = “299.979” >>> DEC = “37.04” >>> date_lower = “2019-10-01” >>> date_upper = “2020-03-27” >>> automatic_BeSS(RA, DEC, size=’0.1’, date_lower, date_upper, band_lower=’6.4e-7’, band_upper=’6.7e-7’) #Data downloaded in the script directory
Routine written by Pedro Ticiani dos Santos
IMPORTANT NOTE: When using this function, the downloaded files go to the script directory. This is something still undergoing work.
- pyhdust.spectools.averagespecs(speclist, n=999, path='', objname='OBJECT')[source]
Average specs taken in the same MJD, in groups of approx. n elements.
OUTPUT: Files written.
- pyhdust.spectools.calcres_R(hwidth=1350, nbins=108)[source]
(h)Width in km/s. WARNING: width in HDUST input is only half. To HDUST effective R, multiple the input width by 2 he_re.
# R = lbd/Dlbd = _phc.c/Dv = _phc.c*nbins/width # nbins = R*width/_phc.c
- pyhdust.spectools.calcres_nbins(R=12000, hwidth=1350)[source]
(h)Width in km/s. WARNING: width in HDUST input is only half. To HDUST effective R, multiple the input width by 2 he_re.
# R = lbd/Dlbd = _phc.c/Dv = _phc.c*nbins/width # nbins = R*width/_phc.c
- pyhdust.spectools.cardelli(lbd, flux, ebv=0.0, Rv=3.1)[source]
Milky Way Extinction law from Cardelli et al. 1989
lbd must be in microns.
OUTPUT: Corrected flux.
- pyhdust.spectools.check_dtobs(dtobs)[source]
Check if the dtobs fits the float format. Required for MJD calc.
- pyhdust.spectools.checkshiftfits(fitslist, lbc=6562.8)[source]
Do shiftfits sistematically
INPUT: list of files
OUTPUT: fits files header updated with WLSHIFT.
- pyhdust.spectools.checksubdirs(path, star, lbc, hwidth=1000, showleg=True, plots=False)[source]
Faz o que tem que fazer.
- pyhdust.spectools.classify_specs(list_of_specs, starid, instrument, calib, comment='')[source]
Do useful things with a list of FITS specs to classify them.
It will (1) generate figures of the specs, with line info; (2) classify the band of observation; (3) copy the file with a standard name.
- pyhdust.spectools.convgaussFunc(wl, flx, lbc, hwidth=1000.0, convgauss=0.0, frac=0.0, ssize=0.05, wlout=False)[source]
Do a Gaussian convolution of a given Line Profile with a Gaussian.
wl, flx, lbc: wavelenght and flux of the spectrum containing the line, and its value.
hwidth, ssize: width to be keeped around the line (km/s), and the region (in percentage) where the continuum level will be evaluted around the selected region.
convgauss: if bigger then 0., do the convolution. Its values is the sigma of the gaussian conv. profile (in km/s).
frac: controls the intensity of the convolution. `frac`=0 means pure profile output and `frac`=1 a pure gaussian output with the same EW value.
wlout: returns a wavelength array instead of a velocity array (standar)
OUTPUT: vel/wl, flux (arrays)
- pyhdust.spectools.cutpastrefspec(ivl, iflx, irefvl, ireflx, hwidth, ssize=0.05)[source]
Cut and paste a given line profile into a reference line profile.
Both profiles (with any resolution) must be normalized and given in vel.
It was designed to solve the problem of Achernar’s Halpha line wings problem and it works like this: given a reference profile (refvl, reflx), the selected profile will be cutted at the hwidth position and them pasted in the corresponding position (and intensity level) of the reference spectrum.
OUTPUT: refvl, reflx
- pyhdust.spectools.diffPlotLineFits(specs, lbc=0.6564606, fmt=['png'], xlim=None, rvel=None, rflx=None, hwidth=1500.0, addsuf='', cmapn='jet', dlim=None, outpath='', ylim=None)[source]
Generate overplot of DIFFERENCE spec. line from a FITS files list. The observations will be linearly interpolated with the reference spec. If none is given as reference, then it assumes the first of the list.
It is recommend to run first (rvel, rflx) = lineProf(rvel, rflx, lbc=lbc, hwidth=hwidth).
If cmap is None or empty, the phc.colors vector is read.
- pyhdust.spectools.diffPlotLineObs(fullseds, obsers=[0], lbc=0.6564606, fmt=['png'], rvel=None, rflx=None, hwidth=1000.0, addsuf='', outpath='')[source]
Generate overplot of DIFFERENCE spec. line from a HDUST OBSERVERS list. The model will be linearly interpolated with the reference spec. If none is given as reference, then it assumes the first observer of the list.
It is recommend to run first (rvel, rflx) = lineProf(rvel, rflx, lbc=lbc, hwidth=hwidth).
Observers config. must be the same between models in fullseds list.
- pyhdust.spectools.diffPlotLineSeries(fullseds, obsers=[0], lbc=0.6564606, fmt=['png'], rvel=None, rflx=None, hwidth=1000.0, outpath='', addsuf='')[source]
Generate overplot of DIFFERENCE spec. line from a HDUST mod list. The model will be linearly interpolated with the reference spec. If none is given as reference, then it assumes the first of the list.
It is recommend to run first (rvel, rflx) = lineProf(rvel, rflx, lbc=lbc, hwidth=hwidth).
Observers config. must be the same between models in fullseds list.
- pyhdust.spectools.diffplotsubdirs(path, star, limits=(6540, 6600))[source]
Realiza o plot de espectros da estrela star dentre do diretorio path. Atualmente, faz o plot entre os valores limits (Angstroms).
Gera os arquivos path/star/star.log e path/star/star_specs_dif.png.
- pyhdust.spectools.din_spec(metadata, lbc=6562.86, hwidth=1500.0, res=50, interv=None, fmt=['png'], outname='din_spec', pxsize=8, vmin=None, vmax=None, avg=True, cmapn='inferno', refspec=None, figsize=None)[source]
Plot dynamical specs. from metadata table of the Spec class.
interv controls the interval between specs (in days).
res is the resolution in km/s.
By default (`avg`=True), the average of spectra in that bin is show. If `avg`=False, the nearest bin-centered (in time) spectra will be shown.
if refspec is not None, them it will be a difference spectra.
- pyhdust.spectools.extractfromsplot(file, splot)[source]
Ce = center; Co = core #LcCe, LcCo, lcGW, lcEW, lvCe, lcCo, lvEW, lrCe, LrCo, lrEW
- pyhdust.spectools.fitzpatrick(wave, flux, ebv, Rv=3.1, LMC2=False, AVGLMC=False)[source]
Deredden a flux vector using the Fitzpatrick (1999) parameterization
- Parameters:
wave (array) – Wavelength in Angstrom
flux (array) – Calibrated flux vector, same number of elements as wave.
ebv (float, optional) – Color excess E(B-V). If a positive ebv is supplied, then fluxes will be dereddened rather than reddened. The default is 3.1.
AVGLMC (boolean) – If True, then the default fit parameters c1,c2,c3,c4,gamma,x0 are set to the average values determined for reddening in the general Large Magellanic Cloud (LMC) field by Misselt et al. (1999, ApJ, 515, 128). The default is False.
LMC2 (boolean) – If True, the fit parameters are set to the values determined for the LMC2 field (including 30 Dor) by Misselt et al. Note that neither AVGLMC nor LMC2 will alter the default value of Rv, which is poorly known for the LMC.
- Returns:
new_flux – Dereddened flux vector, same units and number of elements as input flux.
- Return type:
array
Notes
Note
This function was ported from the IDL Astronomy User’s Library.
The following five parameters allow the user to customize the adopted extinction curve. For example, see Clayton et al. (2003, ApJ, 588, 871) for examples of these parameters in different interstellar environments.
x0: Centroid of 2200 A bump in microns (default = 4.596)
gamma: Width of 2200 A bump in microns (default =0.99)
c3: Strength of the 2200 A bump (default = 3.23)
c4: FUV curvature (default = 0.41)
- c2: Slope of the linear UV extinction component
(default = -0.824 + 4.717/R)
- c1: Intercept of the linear UV extinction component
(default = 2.030 - 3.007*c2
- pyhdust.spectools.gauss_fit(x, y, a0=None, x0=None, sig0=None, emission=True, ssize=0.05)[source]
Return the area of a fitting Gaussian.
- pyhdust.spectools.hydrogenlinewl(ni, nf)[source]
Generate H line transitions wavelengths in meters for VACUUM
Rydberg constant R was manually adjusted to fit Halpha and Hbeta lines.
- pyhdust.spectools.incrPlotLineFits(specs, lbc=0.6564606, fmt=['png'], hwidth=1500.0, yzero=False, addsuf='', dlim=None, cmapn='jet', xlim=None, outpath='', ylim=None)[source]
Generate incremented spec. line from FITS files list. The increment is 0.1 for each file in sequence.
- pyhdust.spectools.incrPlotLineSeries(fullseds, obsers=[0], lbc=0.6564606, fmt=['png'], addsuf='', outpath='')[source]
Generate incremented spec. line from a HDUST mod list, separated by observers. The increment is 0.1 for each file in fullseds sequence.
Observers config. must be the same between models in fullseds list.
- pyhdust.spectools.kurlog(file=None, output=None)[source]
Generate a list of teff and logg present in a Kurucz file.
If output is not specified, it is saved as `file`+.log
- pyhdust.spectools.kuruczflux(teff, logg, wavrange=None)[source]
Return fluxes from a Kurucz model.
Fluxes are in ergs/cm**2/s/hz/ster and wavelength in nm (wavrange must be in nm).
As tabelas do Kurucz sao erg/s/sr/cm2/Hz. Entao, tem q multiplicar 4pi para ter o fluxo observado. Abaixo, a conversao das unidades Kurucz para erg/s/cm2/A usuais.
# erg/s/sr/cm2/Hz: lK15k, K15k, info = spt.kuruczflux(5777, 3., range=[100,1000]) lK15k*= 1e1 #Ang K15k = 2.99792458E+18*K15k*(lK15k)**-2*4*np.pi #erg/s/cm2/A
OUTPUT: wv, flux, info
- pyhdust.spectools.lineProf(x, flx, lbc, flxerr=array([], dtype=float64), hwidth=1000.0, ssize=0.05)[source]
lineProf() - retorna um array (flx) normalizado e um array x em VELOCIDADES. lbc deve fornecido em mesma unidade de x para conversão lambda -> vel. Se vetor x jah esta em vel., usar funcao linfit().
x eh importante, pois y pode ser nao igualmente amostrado. x e y devem estar em ordem crescente.
ssize = % do tamanho de y; numero de pontos usados nas extremidades para a media do contínuo. ‘ssize’ de .5 à 0 (exclusive).
OUTPUT: vel (array), flx (array)
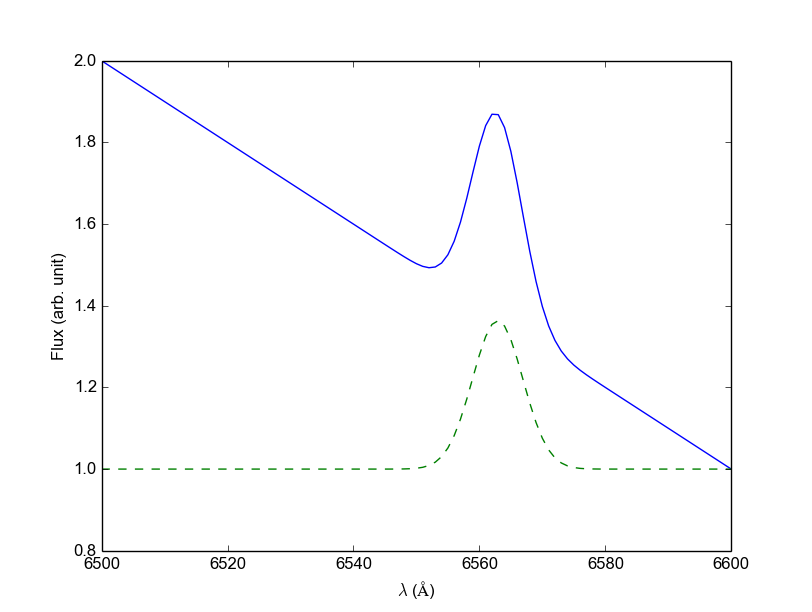
- pyhdust.spectools.linfit(x, y, ssize=0.05, yerr=array([], dtype=float64))[source]
linfit() - retorna um array (y) normalizado, em posicoes de x
x eh importante, pois y pode ser nao igualmente amostrado. x e y devem estar em ordem crescente.
ssize = % do tamanho de y; numero de pontos usados nas extremidades para a media do contínuo. ‘ssize’ de .5 à 0 (exclusive).
OUTPUT: y, yerr (if given)
#Example:
import numpy as np
import matplotlib.pyplot as plt
import pyhdust.phc as phc
import pyhdust.spectools as spt

wv = np.linspace(6500, 6600, 101)
flx = (np.arange(101)[::-1])/100.+1+phc.normgauss(4, x=wv,
xc=6562.79)*5

plt.plot(wv, flx)
normflx = spt.linfit(wv, flx)
plt.plot(wv, normflx, ls='--')

plt.xlabel(r'$\lambda$ ($\AA$)')
plt.ylabel('Flux (arb. unit)')
- pyhdust.spectools.load_specs_fits(speclist, ref, lbc, lncore=None, hwidth=None, gaussfit=False, plotcut=0)[source]
Load a list of specs and do the line core cut & paste
lncore: cut and paste hwidth of the line center. It can be None, and must be < hwidth. If hwidth is None, it is assumed to be 1000 km/s.
speclist : [‘path+file.fits’, …]
ref: reference spectra to do the cut & paste
plotcut: if plotcut > 0, save the cutted spectra in steps of this variable.
OUTPUT: dtb_obs
- pyhdust.spectools.loadfits(fitsfile)[source]
load FITS spec
Out: wl, flux, MJD, dateobs, datereduc, fitsfile
- pyhdust.spectools.max_func_pts(x, y, ws=0.01, avgbox=3)[source]
ws window size where the maximum will be evaluated. Example: ws=0.02 corresponds to 2% of the length of the input.
- pyhdust.spectools.normEW(vl, y, area=None)[source]
Normalize
ycurve to have a specific area. Ifarea is None, then the normalized equivalent width is preserved.
- pyhdust.spectools.normalize_range(lb, spec, a, b)[source]
This function is obsolete and must be removed.
Still here for compatibility issues.
- pyhdust.spectools.normalize_spec(lb, flx, q=2, diff=0.03, perc=0, nlbp=50)[source]
Normalize a spectrum using the non-parametric regression algorithm of Local Polynomial Kernel (order=``q``).
If perc > 0, a “percentile filter” is applyed to the spectrum (divided in nlbp bins).
INPUT: lb, flx
OUTPUT: norm_flx
- pyhdust.spectools.normcontinuum_std(flux, ssize=0.05)[source]
Assumes that the flux vector is normalized.
ssize is the percentage of the flux vector to be sampled as continuum (0-1.); default=0.05.
It returns the standard deviation of the normalized continuum (around 1.0).
- pyhdust.spectools.overPlotLineFits(specs, lbc=0.6564606, fmt=['png'], hwidth=1500.0, ylim=None, yzero=False, addsuf='', dlim=None, cmapn='jet', xlim=None, outpath='')[source]
Generate overplot spec. line from a FITS file list.
- pyhdust.spectools.overPlotLineSeries(fullseds, obsers=[0], lbc=0.6564606, fmt=['png'], convgauss=0.0, frac=0.0, addsuf='', labels=None, hwidth=1000.0, ssize=0.05, outpath='', ylim=[0.7, 2.2], cmapn='gnuplot')[source]
Generate overplot spec. line from a HDUST mod list, separated by observers.
Observers config. must be the same between models in fullseds list.
If convgauss > 0, do a gaussian convolution.
- pyhdust.spectools.overplotsubdirs(path, star, limits=(6540, 6600), showleg=True)[source]
Realiza o plot de espectros da estrela star dentre do diretorio path. Atualmente, faz o plot entre os valores limits (Angstroms).
Gera os arquivos path/star/star.log e path/star/star_specs.png.
- pyhdust.spectools.overplotsubdirs2(path, star, limits=(6540, 6600))[source]
Realiza o plot de espectros da estrela star dentre do diretorio path. Atualmente, faz o plot entre os valores limits (Angstroms).
Ha’ um criterio de escolha de espectros aqui (rudimentar).
Gera os arquivos path/star/star.log e path/star/star_specs2.png.
- pyhdust.spectools.plotSpecData(dtb, limits=None, civcfg=[1, 'm', 2013, 1, 1], fmt=['png'], ident=None, lims=None, setylim=False, addsuf='')[source]
Plot spec class database vs MJD e civil date
Plot originally done to London, Canada, 2014.
INPUT: civcfg = [step, ‘d’/’m’/’y’, starting year, month, day]
lims sequence: ‘EW’, ‘E/C’, ‘V/R’, ‘Pk. sep. (km/s)’, ‘E-F0’, ‘F0’
lims = [[-2,4+2,2],[1.,1.4+.1,0.1],[.6,1.4+.2,.2],[0,400+100,100], [.30,.45+.05,.05],[0.6,1.20+.2,.2]]
If lims is defined, setylim can be set to True.
OUTPUT: Written image.
- pyhdust.spectools.plot_all(fs2list, obsl=None, fmt=['png'], out=None, lbc=0.6564, hwidth=1000.0, solidfiles=True, xax=0, philist=[0], figname=None, nolabels=False, obsidx=False)[source]
plot_all-like routine
obsllist, in degrees. It will find the closest values. It the find \(\Delta\theta > 3^\circ\), a warning message is displayed. Theobsindex can be used ifobsidx = True.solinefileskeep solid lines for files (changes only colors), and change line shapes between observers. IfFalse, do the opposite.
- pyhdust.spectools.plot_line_str(fig, ax, lbc='', ylabel='', fs=14, xlim=None, dlim=None, cmapn='gnuplot', lfs=10, ylim=None)[source]
Line plotting structure
- pyhdust.spectools.plot_spec_info(speclist, dtb_obs, mAEW=False, mgray=None)[source]
Standard plot of the Spec class (EW, E/C, V/R, peak-sep., FWHM, F0)
OUTPUT: figure (fig pyplot)
- pyhdust.spectools.refplotsubdirs(path, star, limits=(6540, 6600))[source]
Realiza o plot de espectros da estrela star dentre do diretorio path. Atualmente, faz o plot entre os valores limits (Angstroms).
Gera os arquivos path/star/star.log e path/star/star_specs_REFERENCIA.png.
- pyhdust.spectools.renorm(vl, y)[source]
Renormalize
yso that the equivalent width is preserved when the continuum is shifted to 1.
- pyhdust.spectools.shiftfits(fitsfile, newsh=None, verbose=False)[source]
Update FITS spec header for a given shift value.
- pyhdust.spectools.sort_specs(specs, path=None)[source]
Specs in an (N,2) array, where specs[:,0] are the files paths and specs[:,1] the instrument name.
Return ordered_specs
- pyhdust.spectools.spec_time(speclist, lbc=6562.8, ref_spec='/data/Dropbox/work/sci_16-15aeri/alpEri_FEROS_2000AVE.mt', mod_lbc=0.656461, MJDref=None, mod_ref='/data/Dropbox/work/sci_16-15aeri/fullsed_mod03_VDDn0_1p4e12_Be_aeri2014.sed2', fmt=['png', 'pdf'], outname=None, cmapn='inferno', hwidth=1000.0, outpath='', figsize=(5, 7), ysh=0.01)[source]
Plot specs over time as suggested by Rivi.
speclistis an array of strings to the path of the *.fits files.ref_specis a reference *.fits andmod_refan hdust reference model. They are ignored if the path is not found.isyshcontrol the vertical separation of the profiles.
- pyhdust.spectools.spec_time_Achernar(speclist, lbc=6562.8, fmt=['png', 'pdf'], outname=None, cmapn='inferno', hwidth=1000.0, outpath='', figsize=(5, 15), ysh=0.01)[source]
Plot specs over time as suggested by Rivi
- pyhdust.spectools.splitKurucz(filen, path=None)[source]
Split atmospheric Kurucz file (e.g., ‘ap00k0.dat’) into individual models.
INPUT: file, path (strings)
OUTPUT: *files written
- pyhdust.spectools.vac2air(wl)[source]
The IAU standard for conversion from air to vacuum wavelengths is given in Morton (1991, ApJS, 77, 119). For vacuum wavelengths (VAC) in Angstroms, convert to air wavelength (AIR) via: AIR = VAC / (1.0 + 2.735182E-4 + 131.4182 / VAC^2 + 2.76249E8 / VAC^4 )
- pyhdust.spectools.vel2wl(vel, lbc)[source]
Vel. to wavelength. Vel must be in km/s and output is in lbc units.
- pyhdust.spectools.wl2vel(wl, lbc)[source]
Wavelength to vel., in km/s. wl and lbc units must be the same.
- pyhdust.spectools.writeFits(flx, lbd, extrahead=None, savename=None, verbose=False, path=None, lbdc=None, externhd=None)[source]
Write a 1D spectra FITS.
INPUT: flux array, lbd array, extrahead flag+info, save name.- lbd array: if len(lbd)==2: lbd = [CRVAL1, CDELT1]else: CDELT1 = (lbd[-1]-lbd[0])/(len(lbd)-1)CRVAL1 = lbd[0]WARNING: lbd must be in ANGSTROMS (FITS default). It can also bevelocities. In this case, it must be in km/s and lbdc is given inANGSTROM.- extrahead: matrix (n,2). Example: [[‘OBJECT’,’Achernar’], [‘COMMENT’,‘value’]]externhd = copy the header from an external file.
OUTPUT: write FITS file.