interftools: module of interferometric tools
PyHdust interftools module: interferometry tools
colors keep the amdlib standard.
A biblioteca python XDRLIB eh MUITO lenta… Usa muitas listas!!!
>>> import xdrlib
A biblioteca PYDAP estah em desenvolvimento… Eh complicada de usar
>>> from pydap.model import *
>>> from pydap.xdr import DapUnpacker
>>> base_int = BaseType(name='base_int')
>>> base_float = BaseType(name='base_float', type=Float32)
Todas as leituras binarias baseiam-se no struct.
Rotines based on images (np.array matrix)
Rotines based on oifiles
Rotines based on HDUST (maps/data)
Other?
- license:
GNU GPL v3.0 https://github.com/danmoser/pyhdust/blob/master/LICENSE
- class pyhdust.interftools.Disk(lbd=[0.001], barz2=1.0, Td=12120.0, fion=1.0, mu=0.5, gb=None, rho=2.8e-11)[source]
To compute Vieira’s models.
lbd in cm (np.array. If None, default value from _phc.BBlbd), barz2 is the mean value of the square atomic number, Td isothermal disk temperature, fion is the ionization fraction, mu (\(\mu\)) is the mean particle weight (mH units), gb is the…
Ms is the stellar mass (Msun).
- pyhdust.interftools.I(Disk, Ms=7.7, Teff=20200.0, Rs=4.94, iang=0.0, bm2n=-5.5, fmin=0.005, Rmax=None, px=128, bartau=None)[source]
I is the specific intensity of the star plus an isothermal disk. The effects of limb-darkening, stellar rotation and circumstellar extinction are neglected. Image constructed from LOWER origin.
Disk: lbd is determined in Disk (lambda vector in cm).
Teff is the stellar effective temperature (K). All derived quantities are based on this value, but the stellar emission, that is corrected by the fBBcor function.
Rs, the stellar (equatorial) radius (Rsun).
iang, inclination angle (deg).
bm2n is the \(-2n+\beta < 0\) value.
fmin, minimum flux at the semi-major axis as fraction of the thick disk flux.
Rmax, maximum radius of the images.
METHOD: If Rmax is None, then Rmax of the image is automatically calculated where Athin is equal to fmin * BBlbd(Tdisk) at the longest (vector last position) wavelength. Else, the Rmax value is taken. Rmax goes to all wavelengths.
px, image side in pixels (squared output).
bartau = if None, 1.3 is considered. Otherwise, it is a vector with same dimensions of Disk.lbd. See that bartau do not changes the emission in Eq. 12(c, Vieira+2015).
OUTPUT: (squared) images(len(lbd), px, px). The flux unit per pixel is BBlbd(Teff*fBBcor(Teff)) (cgs), in an area of pixelsize**2. (pixelsize info is printed).
- pyhdust.interftools.bin_map(mfile, nbins, new_pref='BIN_')[source]
Bin SED each n bins (lambda).
It AUTOMATICALLY removes the NaN entries.
- pyhdust.interftools.data2fitscube(data, obs, lbdc, xmax, dist, zoom=0, outname='model', orient=0.0, rot=0.0, lum=0.0, coordsinf=None, map=False, deg=False)[source]
Export a set of images (e.g., data[zoom,obs,:,:,:]) to the fits cube format.
map = if data is a *.map file, set it to True. Leave false to *.maps.
lbdc is the wavelength array and the dimension is kept as it is. It must be in meters for JMMC softwares (ASPRO2/LITPRO).
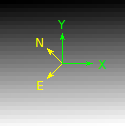
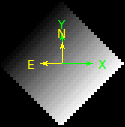
rot = rotation angle to be applied to the images. ‘x’ and ‘y’ coordinate axes should be orientated with equatorial north corresponding to ‘up’ (and east == ‘left’). Units in Degrees.
orient = orientation of the coordinate system. This is completely independent of the rot variable.
lum = luminosity given in Solar units. BUNIT sets the units of the image. Considering that HDUST images give the pixels counts as \(F_\lambda/F\), the same correction as done to BeAtlas is performed, and the final results are in 10^-17 erg/s/cm^2/Ang. If lum = 0, no change is done.
coordsinf = [RA,DEC]. Example: [‘21:51:12.055’, ‘+28:51:38.72’]
deg = angles in degrees (instead of radians).
- pyhdust.interftools.dataphot(data, lbdc, xmax, im=0, obs=0, iflx=0, dist=10, PA=0.0, B=100.0, PAdisk=90.0, quiet=False, diff=True, phiunit=True)[source]
Return photocenter positions for a given hdust data file.
If *.map file format, it takes iflx image layer.
input: data (np.ndarray), dist (float, parsecs)
output: lbdc, V2, DP (float arrays)
- pyhdust.interftools.datinterf(data, lbdc, xmax, im=0, obs=0, iflx=0, dist=10, PA=0.0, B=100.0, PAdisk=90.0, quiet=False, normV2=False)[source]
Return Squared Visibilities (V2) and Diferential Phases (DP) for a given hdust data file.
If *.map file format, it takes iflx image layer.
input: data (np.ndarray), dist (float, parsecs)
output: lbdc, V2, DP (float arrays)
- pyhdust.interftools.fastnumvis(img, lbd, Bproj, PA, rad_per_pixel, PAdisk=90.0, silent=False)[source]
- For a given image (in phys.units = rad_per_pixel) and a interf. setup,
it returns the visibility and phase.
PA and PAdisk in degrees.
Bproj and lbd must have the same units (m).
output: complexVis, VisAmp, VisPhase
- pyhdust.interftools.fastnumvis3(img, lbd, Bprojs, PAs, rad_per_pixel, PAdisk=90.0)[source]
For a given image (in phys.units = rad_per_pixel) and 3 telescopes interferometric setup, it returns the visibility and closure phase.
Is
PA as array/list (two values) and PAdisk in degrees.
Bproj as array/list (two values) and lbd must have the same units (m).
output: complexVis, VisAmp, VisPhase (closure phase)
- pyhdust.interftools.img2fits(img, lbd, xmax, dist, outname='model', rot=0.0, lum=0.0, orient=0.0, coordsinf=None, deg=False, ulbd='meters')[source]
Export an image (e.g., data[0,0,0,:,:]) to the fits format.
lbd is the wavelength value. It must be in meters for JMMC softwares (ASPRO2/LITPRO).
ulbd units description in the header. If empty or None, the CDELT3 and CRVAL3 entries are no written in the header.
rot = rotation angle to be applied to the images. ‘x’ and ‘y’ coordinate axes should be orientated with equatorial north corresponding to ‘up’ (and east == ‘left’). Units according to deg bool.
orient = orientation of the coordinate system. This is completely independent of the rot variable. Units according to deg bool.
lum = luminosity given in Solar units. BUNIT sets the units of the image. Considering that HDUST images give the pixels counts as \(F_\lambda/F\), the same correction as done to BeAtlas is performed, and the final results are in 10^-17 erg/s/cm^2/Ang. If lum = 0, no change is done.
coordsinf = [RA,DEC], as [‘21:51:12.055’, ‘+28:51:38.72’] – F2000.0
deg = angles in degrees (instead of radians).
Example: image at 21 cm, rotated 45 degrees, 2 AU long at 10 parsecs.
img = np.arange(900).reshape((30,30))

intt.img2fits(img, 21., [2*phc.au.cgs/phc.Rsun.cgs], 10, orient=45.,
coordsinf=['21:51:12.055', '-28:51:38.72'], ulbd='cm', deg=True)
intt.img2fits(img, 21., [2*phc.au.cgs/phc.Rsun.cgs], 10, rot=45.,
coordsinf=['21:51:12.055', '-28:51:38.72'], ulbd='cm', deg=True,
outname='model_rotated')
- pyhdust.interftools.imshowl(img, cmap='gist_heat', origin='lower')[source]
Plot the normalized image in log-scale.
- pyhdust.interftools.mapinterf(modf, im=0, obs=0, iflx=0, dist=10, PA=0.0, B=100.0, PAdisk=90.0, quiet=False)[source]
Return Squared Visibilities (V2) and Diferential Phases (DP) for a given hdust map(s) file.
- Parameters:
output: lbdc, V2, DP (float arrays, as function of wavelength)
- class pyhdust.interftools.oiClass(oitype, oifile=None)[source]
PyHdust class for interferometric data.
- pyhdust.interftools.plot_oifits(oidata, ffile='last_run', fmt=['png'], xlim=None, legend=True, outfold='./')[source]
Standard observational log for AMBER
If the file starts with
PRODUCT_, it searchs for the specs in the “AVG” folder.(One could write this info into the fits file. Since I’ve only tested the reading features of the oifits routine, I prefered do it this way).
- pyhdust.interftools.plot_phi3_res(ax, ax2, oidata, colors, names, modfiles, obsdeg=None, dist=None, xlim=None, PAs=[-180, 180], PAsrev=False, PArv=[0, 0], bindata=0, quiet=False, alp=0.75, printsum=False)[source]
modfiles = models!
bindata refers to vis2.wavelength.eff_wave!! In other words: the binning only works on simultaneous observations with different \(\lambda\).
- pyhdust.interftools.plot_pio_res(loic, oitype='PIO', outname=None, legend=True, fmt=['png'], PAs=[-180, 180], lcor=None, lmk=None, legbbox=None, ard=None, rylim=None, v2leg=None)[source]
Plot a OIFITS files with VIS2 and CP information and RESIDUALS.
- Parameters:
loic – list of
oiC. Only the firstloiwill have the uv
plane coverage plotted. :param legbbox: legend(bbox_to_anchor) coordinates (list or tuple).
If
PAs != [-180, 180], then a limited range of PAs will be plotted.
- pyhdust.interftools.plot_pio_res_old(oidata, modellist, outname=None, fmt=['png'], legend=True, obsdeg=[60.6], distpc=42.75, quiet=False, xlim=None, bindata=0, PAs=[-180, 180], PAsrev=True, shv2sum=False)[source]
Obs-Model comparison for PIONIER
legend: ?
obsdeg: ?
bindata: ?
PArev: Plot the reverse of the observed PAs
shv2sum: ?
- pyhdust.interftools.plot_pionier(loic, oitype='PIO', outname=None, legend=True, fmt=['png'], PAs=[-180, 180], lcor=None, lmk=None)[source]
Plot a OIFITS files with VIS2 and CP information.
loicis a list of oic classes.Only the first
loiwill have the uv plane coverage plotted.If
PAs != [-180, 180], then a limited range of PAs will be plotted.
- pyhdust.interftools.plot_pionier_old(oidata, ffile='last_run', fmt=['png'], legend=True, model=None, obs=None, dist=None)[source]
Standard observational log for PIONIER
obs is a list dist is a number
- pyhdust.interftools.plot_pionier_res(oidata, model, outname=None, fmt=['png'], legend=True, obs=None, dist=42.75, quiet=True, xlim=None, bindata=0, PArange=[-180, 180], PArr=True, shv2sum=False)[source]
Obs-Model comparison for PIONIER
model, obs are lists dist is a number PArange is in deg., from -180 to 180.
- pyhdust.interftools.plot_t3_img(ax, oidata, img, xlim=None, quiet=False, alp=0.75)[source]
IMG from LitPRO
TODO: scales
- pyhdust.interftools.plot_uv_old(ax, oidata, colors, names, PAs=[-180, 180], PAsrev=False, PArv=[0, 0], xlim=None)[source]
Plot uv map of a given oidata.vis
- pyhdust.interftools.plot_v2_img(ax, oidata, img, xlim=None, quiet=False, alp=0.75)[source]
IMG from LitPRO
TODO: scales
- pyhdust.interftools.plot_v2_res(ax, ax2, oidata, colors, names, modfiles, obsdeg=None, dist=None, xlim=None, PAs=[-180, 180], PAsrev=False, PArv=[0, 0], bindata=0, quiet=False, alp=0.75, printsum=False)[source]
datas = models!
bindata refers to vis2.wavelength.eff_wave!! In other words: the binning only works on simultaneous observations with different \(\lambda\).
- pyhdust.interftools.printinfo(file, extract=False)[source]
Print AMBER OIFITS observational info.
If extract is False, output is: - DATE-OBS, MJD, Target, B1, PA1, B2, PA2, B3, PA3.
If True, output is: - [DATE-OBS, MJD, Target, B1, PA1, B2, PA2, B3, PA3], WAVE, DPlist, V2list
Where, DPlist = [DP1, eDP1, DP2, eDP2, DP3, eDP3] and V2list = [V2_1, eV2_1, V2_2, eV2_2, V2_3, eV2_3].
- pyhdust.interftools.readmap(mapfile, quiet=False, old=False)[source]
Read Hdust MAP or MAPS files.
mapimg: extract this component from the .map file.
0 = total flux
1 = transmitted flux
2 = scattered flux
3 = emitted flux
4 = pol. Q flux
5 = pol. U flux
6 = pol. V flux
OUTPUT = data, obslist, lbdc, Ra, xmax
data = image matrix
obslist = observers info (i, \(\phi\))
lbdc = central \(\lambda\)
Ra = ?
xmax = image size in Rsun untis
data(nimgs,nobs,nlbd,ny,nx,dfact).map, dfact = 6.maps, dfact = 1
- pyhdust.interftools.readoifits(oifile, oitype='PIO', quiet=True)[source]
Read the oifits files/oidata according to its oitype.
Possible oitypes=[“PIO”, “AMB”]
- pyhdust.interftools.reversePAs(PAs=[-180, 180])[source]
Calculte the reverse of the PAs input range.
OUTPUT: PArv (list, units deg)
- pyhdust.interftools.savemap(mfile, imap, obslist, lbdc, Ra, xmax, new_pref='BIN_', logspaced=False)[source]
Read Hdust MAP or MAPS files.
imap: extract this component from the .map file.
0 = total flux
1 = transmitted flux
2 = scattered flux
3 = emitted flux
4 = pol. Q flux
5 = pol. U flux
6 = pol. V flux
INPUT = mfile, imap, obslist, lbdc, Ra, xmax
imap = image matrix
obslist = [observers info] (array of (i, \(\phi\)))
lbdc = central \(\lambda\)
Ra = ?
xmax = [image size in Rsun untis] (length of nimgs)
logspaced = is lbdc log-spaced (base 10)?
imap(nimgs,nobs,nlbd,ny,nx,dfact).map, dfact = 6.maps, dfact = 1
- pyhdust.interftools.setspacecoords(nx, ny, rad_per_pixel, xc=0.0, yc=0.0)[source]
return xx and yy, 2D physical coordinates in ANGULAR dimensions (unit = defined by ‘rad_per_pixel’, i.e., radians). The physical scale (or length) on both axis must be the same.
xc and yc are the the center position in PIXELS
- pyhdust.interftools.t3res_plot_ax(ax, loic, PAs=[-180, 180], lcor=None, lmk=None, rylim=None)[source]
Axis plot of t3 residuals
- Parameters:
loic – list of
oiCmodels. The first one is considered as
observational data, and the others as models.